Geschreven door Matthias van den Berg
Create more complex dashboards with Splunk 8.2 Dashboard Studio
Up until Splunk 8.2 Splunk has been lacking in the visualization department, as it relied on simple XML to create its dashboards. Although dark mode was a welcome addition in Splunk 7.2, you are still bound by a grid layout and limited options to customize the dashboard. If you wanted to add an image to your dashboard as a user you had to ask your Splunk team to add the image to the Splunk app so that you as a user could use it.
Here's a look at an example of a traditional Splunk dashboard:

Starting with Splunk 8.2 there is now a new prompt when you want to create a dashboard:
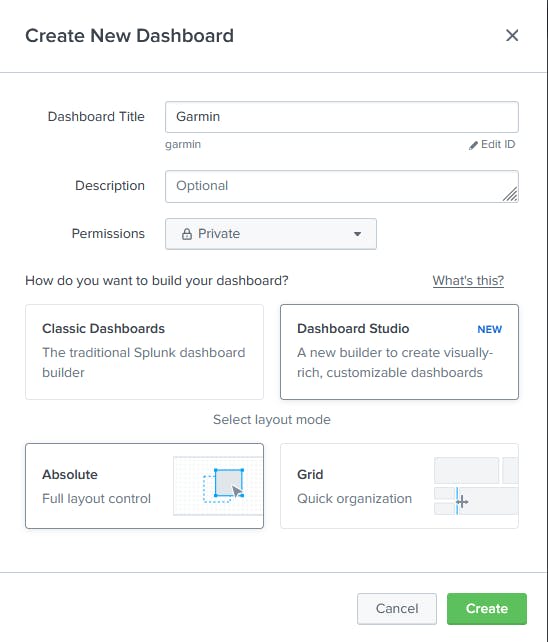
You can now choose between Classic Dashboards (simpleXML) or Dashboard studio(JSON)
When you choose Dashboard Studio you also get to choose the layout mode Absolute or Grid.
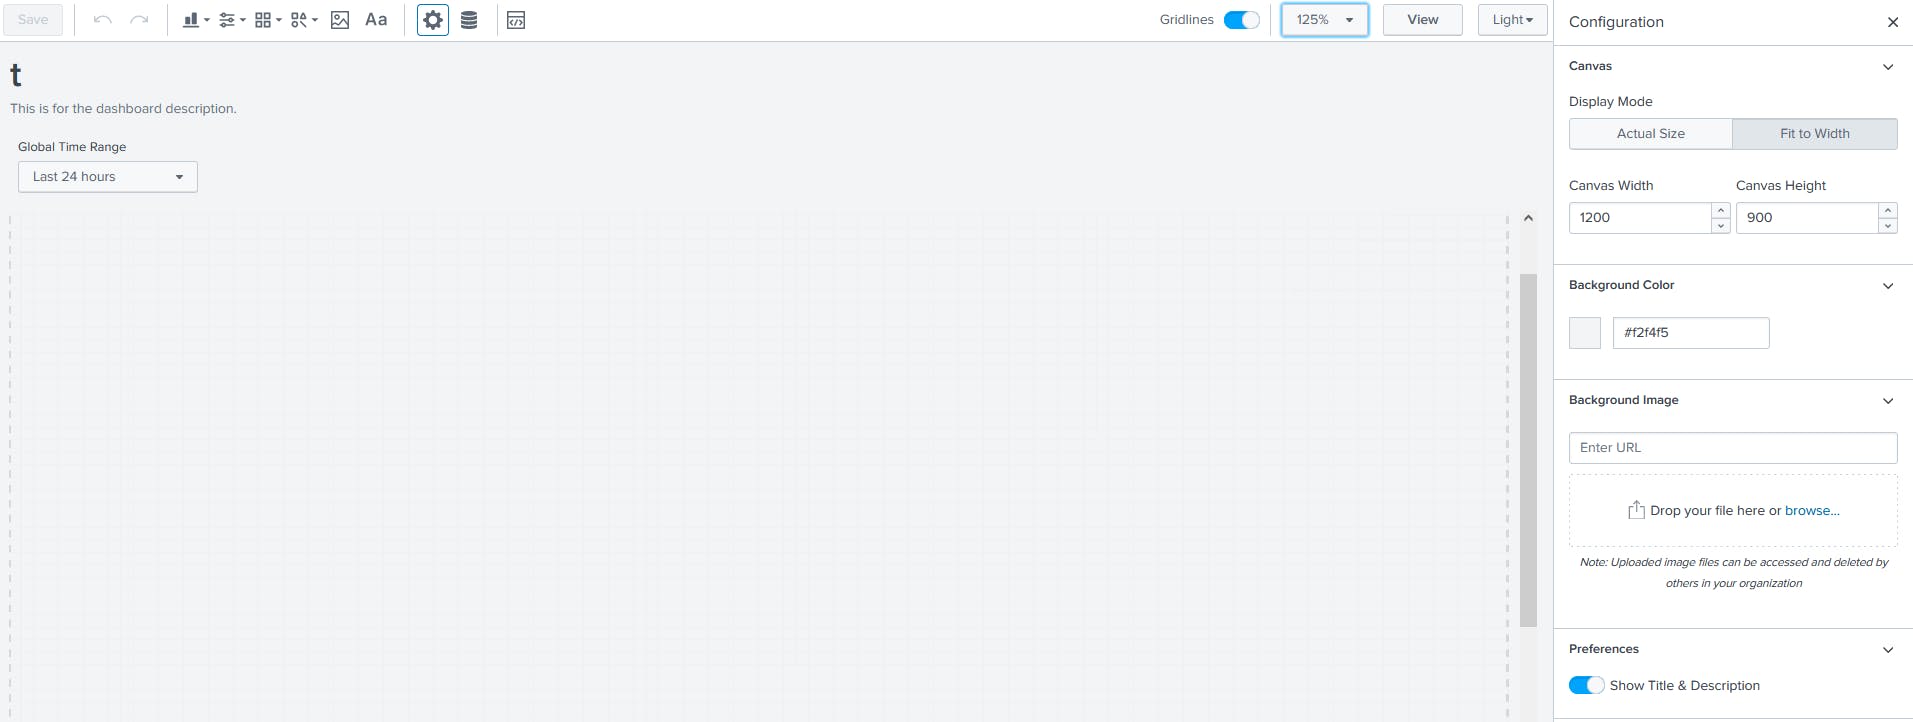
In this example we are using Absolute to see what we can do. You get a blank canvas where you can set a background color or image. At the top left there are the buttons to add the following:
- Visualizations
- Inputs
- Icons
- Shapes
- Images
- Text
To start I added a picture and a few simple singles to the dashboard.
Then I tried to move the picture around change the background color and added a table. It is awesome to see that you can just drag and drop each element to where you want them.
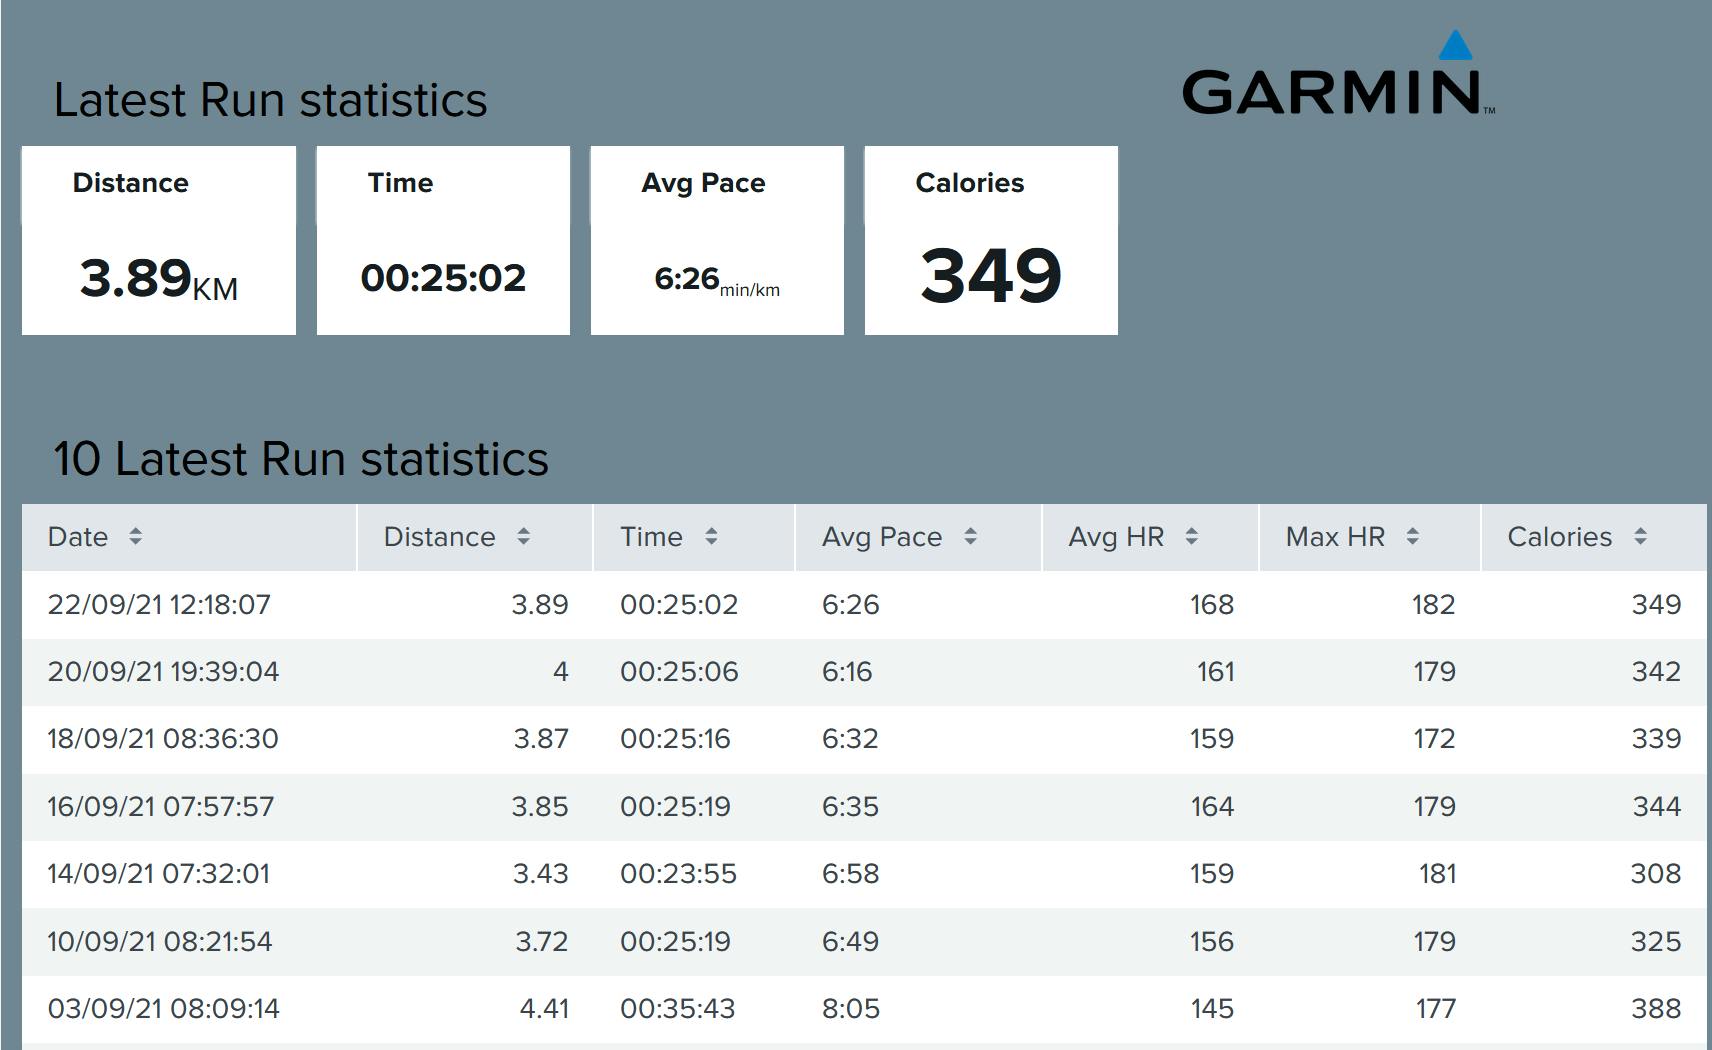
It is also pretty easy to change the background color of each element or even to make it transparent.
The one thing to realize is that Splunk no longer uses xml as the backend for the dashboard but JSON. So if you do decide to change something you will see something like the following:
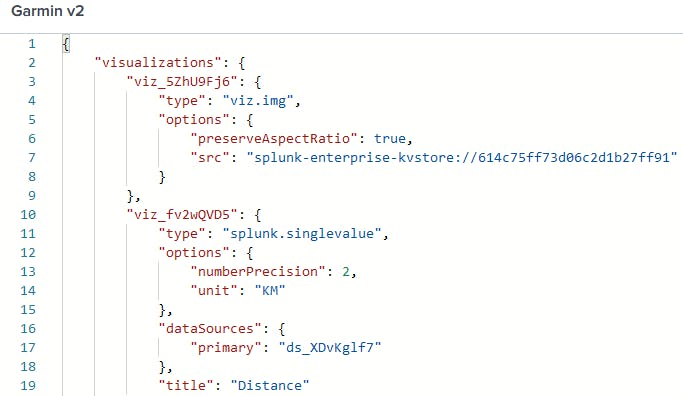
For long time Splunk users, this might take a while to get used to.
You can use this article in the Splunk docs to see what options you could add in the JSON file for your visualizations. Splunk also provides an example hub which shows visualizations and even complete dashboards as examples to get an idea of what you could do with dashboard studio.

If you already have dashboard that you made in older versions of Splunk you can open it in Splunk and select the 3 dots in the top right corner. This will give you the option to select Clone in Dashboard Studio.
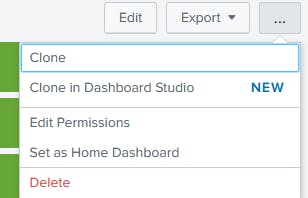
The layout might not be a 100% match but at the very least you get all of the searches and visualizations that you had on your old dashboard.
All in all the new dashboard studio is a welcome change for Splunk users as it finally gives users more options and flexibility in how they want to present their data. For Splunk admins: if you are planning to upgrade to 8.2 make sure you inform your users and be prepared to get questions about the usage of Dashboard Studio.
Geschreven door CINQ